A Guide to Snowflake's Query Profile
If you've ever written a SQL query, chances are you've encountered a query that had you twiddling your thumbs. Learning how to read Snowflake's Query Profile is the most powerful tool for diagnosing and optimizing these long expensive queries.
What is a Query Profile?
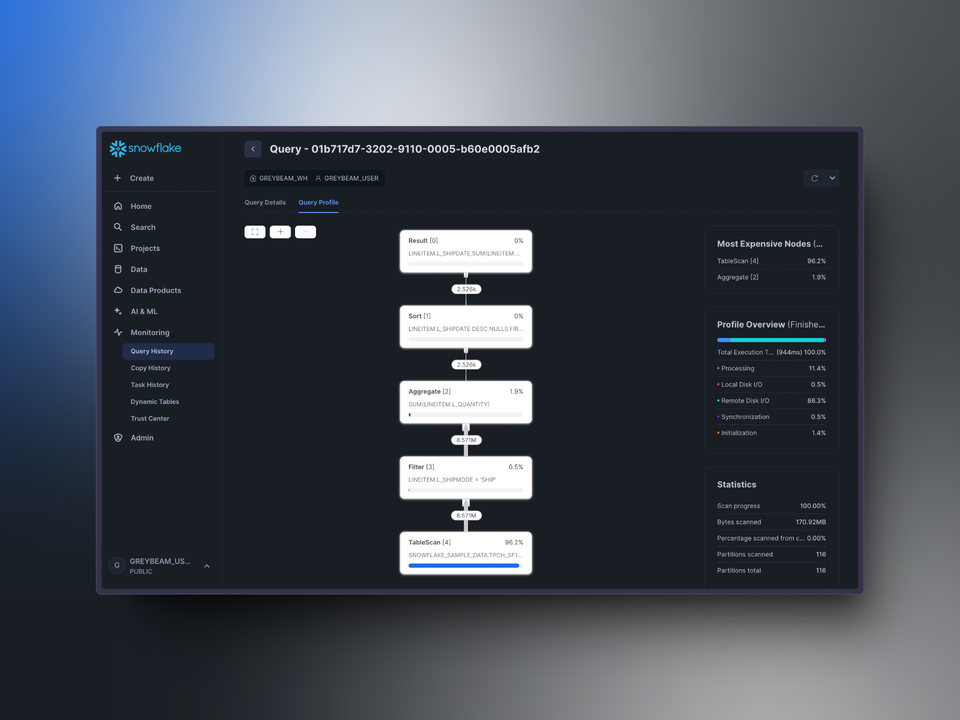
The Query Profile provides a detailed breakdown of how Snowflake executes your SQL queries. Within the query profile lies the coveted query plan, which details the steps Snowflake takes to execute the SQL query. When you submit a query, Snowflake's optimizer generates this plan, determining the most efficient way to retrieve and process the data you've requested. So when a query is taking longer to run than you'd like, it's time to take a look at exactly what's happening in the query profile.
Accessing the Query Profile
There are a few ways to access a query's profile, the simplest is within the Snowsight worksheet itself:
How to access the query profile within a Snowsight worksheet.
Alternatively
- Run the command below directly in a Snowsight worksheet and the plan will be displayed as a table.
select * from table(get_query_operator_stats('query_id'));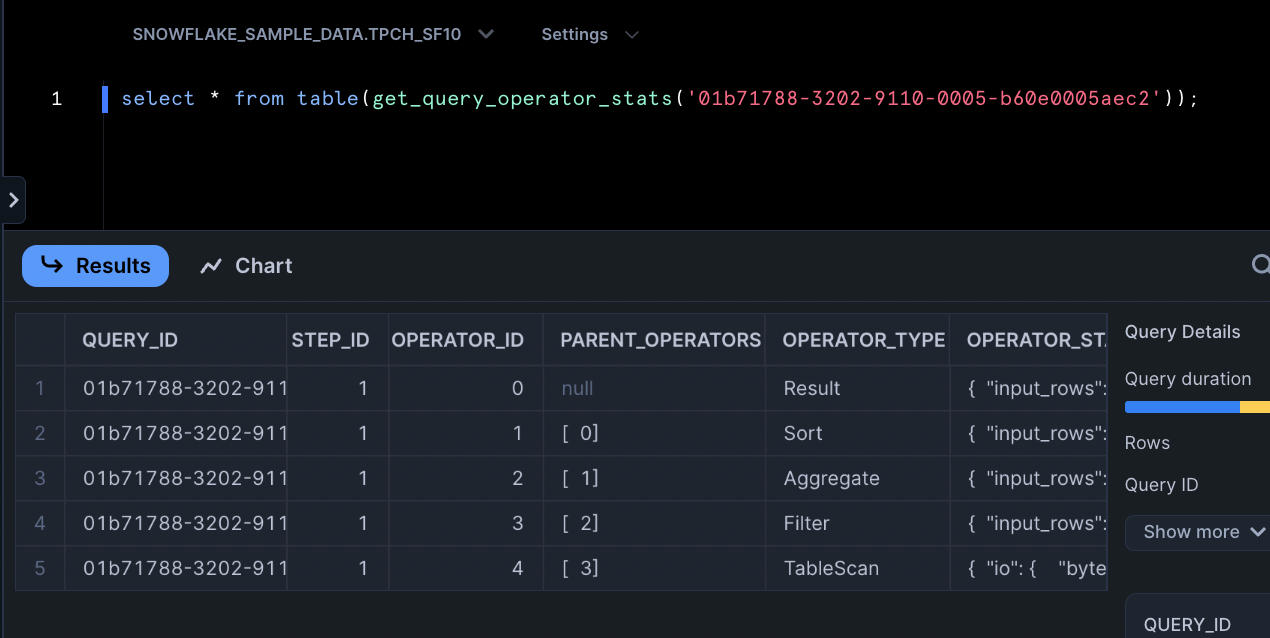
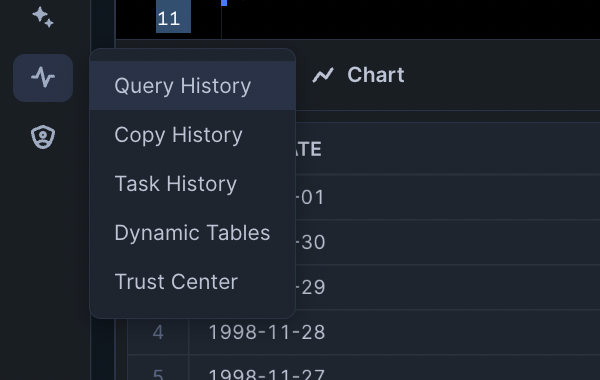
- Use the navigation bar on the left > Query History > select your query
How to Read the Query Plan
The query plan is represented as a tree with nodes (also known as operators), each node performs a specific task in the data retrieval and processing pipeline. These nodes include, but are not limited to, table scans, filtering, joins, aggregations, etc., a full list can be found here.
Example
Let's consider the example below, where's we're calculating total quantity by ship date for AIR and SHIP shipments.
SELECT
    l_shipdate
    , SUM(l_quantity) as quantity
FROM lineitem
WHERE
    l_shipmode IN ('SHIP', 'AIR')
GROUP BY 1
ORDER BY l_shipdate DESC
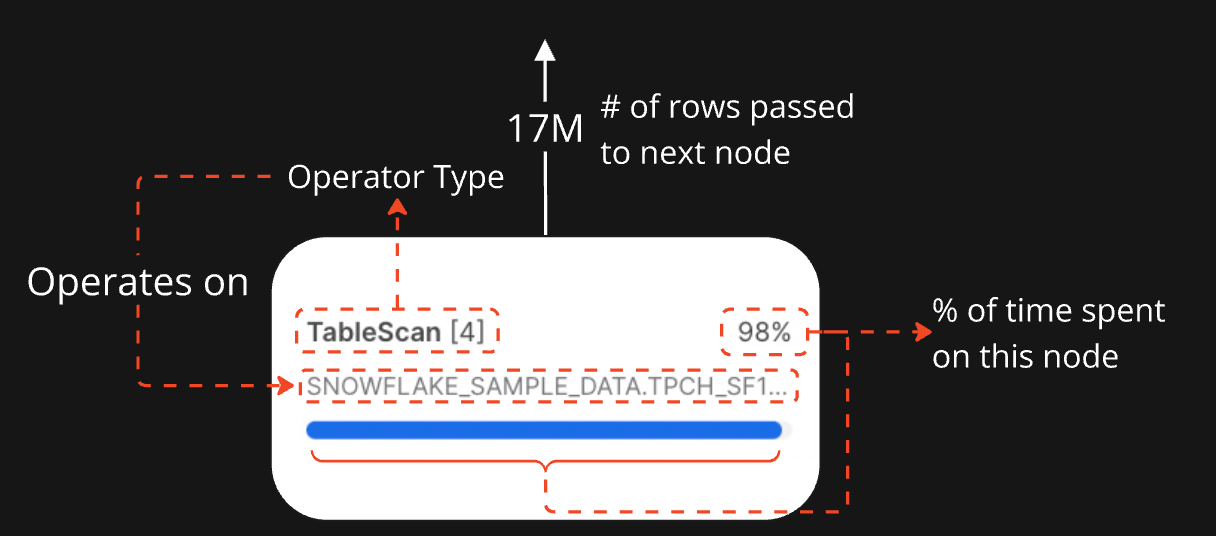
The arrows between nodes show how data moves through the plan, with the number of rows passed to the next node displayed on each arrow. Let's dive into how we can understand each node within the query plan.
How to look at node attributes.
TableScan
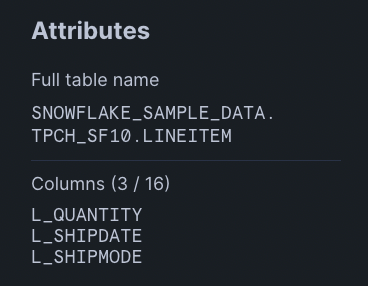
Queries often start with a TableScan, which represents reading data from a table. This operator reads from LINEITEM and only reads the columns L_QUANTITY, L_SHIPDATE, and L_SHIPMODE.
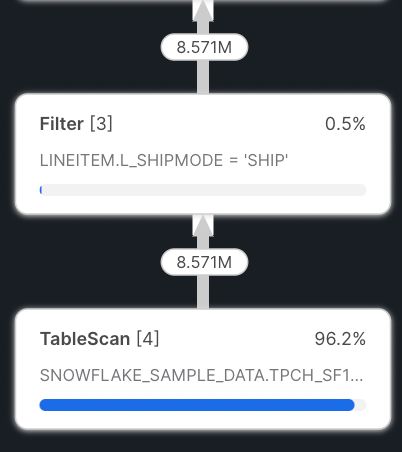
Note that typically, Snowflake pushes down filters from WHERE clauses into the TableScan, allowing for more efficient reads since there is less data to be scanned. This is known as predicate pushdown. In our case, you can see that this happens since the rows emitted from the TableScan match the number of rows emitted by the Filter.
Here we also note that Snowflake spent 96% of the execution time on the TableScan. This is expected and most queries will have TableScans or Joins as the most expensive node.
Aggregate
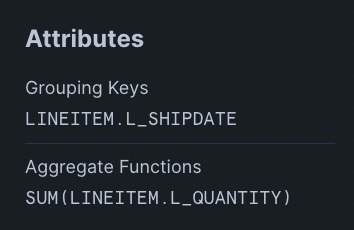
Aggregate is responsible for any aggregation functions including but not limited to: SUM, AVG, MIN, MAX, LISTAGG, etc. If there are multiple aggregation functions within the same step, they'll be aggregated into a single node. Window functions are not considered an aggregate operator.
Sort
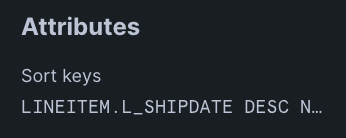
Sort may also be seen as SortWithLimit. This operator is responsible for any sorting or row limit functions like ORDER BY or LIMIT. In our example, we ORDER BY l_shipdate.
Result
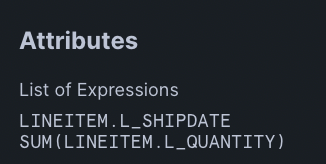
A Result node will always be the final node in a SQL query. This represents Snowflake returning the results of the query to its origin. We return L_SHIPDATE and SUM(L_QUANTITY).
Conclusion
Mastering Snowflake's Query Profile is essential for optimizing query performance and controlling costs. By understanding how to interpret the execution plan and key metrics, you can identify and resolve performance bottlenecks efficiently. Remember, query optimization is often an iterative process – use the Query Profile as your guide to continually refine and improve your SQL.


Comments ()