A Deep Dive into Snowflake's Query Cost Attribution: Finding Cost per Query

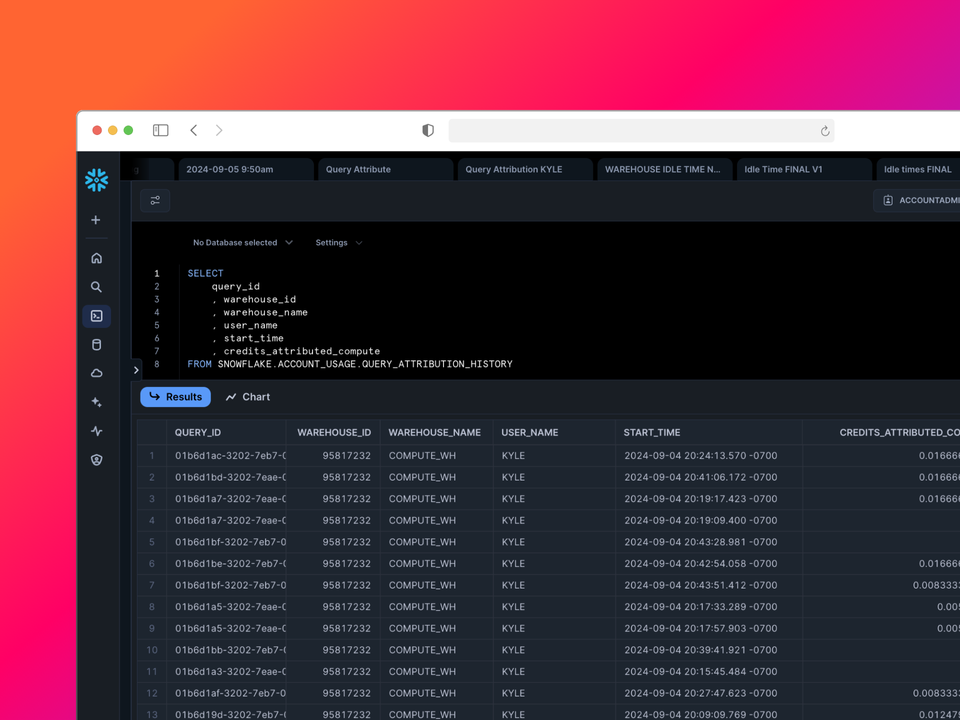
Snowflake recently released a new feature for granular cost attribution down to individual queries through the QUERY_ATTRIBUTION_HISTORY view in ACCOUNT_USAGE. As a company focused on SQL optimization, we at Greybeam were eager to dive in and see how this new capability compares to our own custom cost attribution logic. What we found was surprising - and it led us down a rabbit hole of query cost analysis.
The Promise and Limitations of QUERY_ATTRIBUTION_HISTORY
The new view aims to provide visibility into the compute costs associated with each query. Some key things to note:
- Data is only available from July 1, 2024 onwards
- Short queries (<100ms) are excluded
- Idle time is not included in the attributed costs
- There can be up to a 6 hour delay in data appearing
There's also a WAREHOUSE_UTILIZATION view that displays cost of idle time. At the time of writing, this must be enabled by your Snowflake support team.
Our Initial Findings
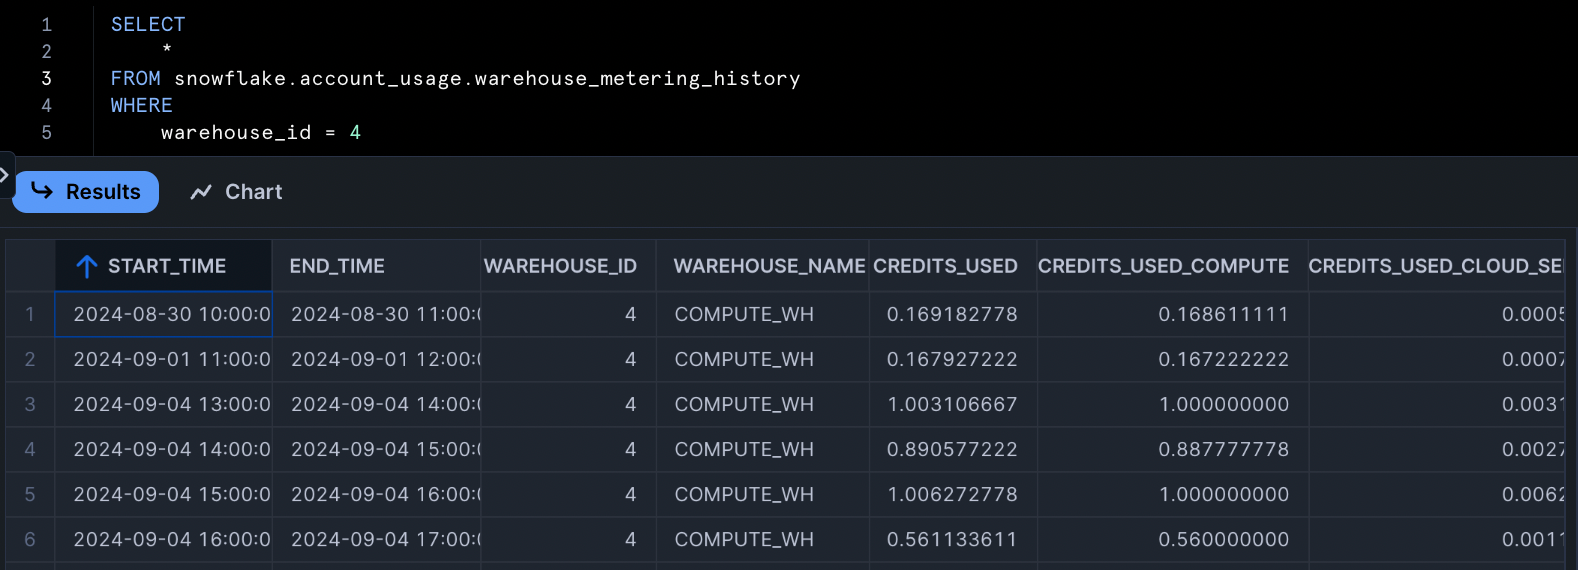
We set up a test with an X-Small warehouse and 600 second auto-suspend to dramatically illustrate idle time. Running a series of short queries (mostly <500ms) over an hour, we expected to see a very small fraction of the total credits in that hour attributed to our queries, but we were very wrong.
On September 4th at the 14th hour, ~40 seconds of queries were executed and some how in the QUERY_ATTRIBUTION_HISTORY view it showed that nearly half of the total credits (0.43 of 0.88) attributed to query execution. This seemed impossibly high given the short query runtimes, yet the pattern continues.

This may just be an anomaly in our Snowflake account, so try it yourself.
WITH query_execution AS (
    SELECT
        qa.query_id
        , TIMEADD(
                'millisecond',
                qh.queued_overload_time + qh.compilation_time +
                qh.queued_provisioning_time + qh.queued_repair_time +
                qh.list_external_files_time,
                qh.start_time
            ) AS execution_start_time
        , qh.end_time::timestamp AS end_time
        , DATEDIFF('MILLISECOND', execution_start_time, qh.end_time)*0.001 as execution_time_secs
        , qa.credits_attributed_compute
        , DATE_TRUNC('HOUR', execution_start_time) as execution_start_hour
        , w.credits_used_compute
    FROM SNOWFLAKE.ACCOUNT_USAGE.QUERY_ATTRIBUTION_HISTORY AS qa
    JOIN SNOWFLAKE.ACCOUNT_USAGE.QUERY_HISTORY AS qh
        ON qa.query_id = qh.query_id
    JOIN SNOWFLAKE.ACCOUNT_USAGE.WAREHOUSE_METERING_HISTORY AS w
        ON execution_start_hour = w.start_time
        AND qh.warehouse_id = w.warehouse_id
    WHERE
        qh.warehouse_id = 4
)

SELECT
    DATE_TRUNC('HOUR', execution_start_time) AS hour
    , SUM(execution_time_secs) AS total_execution_time_secs
    , COUNT(*) AS num_queries
    , SUM(credits_attributed_compute) AS query_credits
    , ANY_VALUE(credits_used_compute) AS metered_credits
FROM query_execution
GROUP BY ALL
ORDER BY 1 ASC
;
Digging Deeper
To investigate further, we compared the results to our own custom cost attribution logic that accounts for idle time. Here’s a snippet of what we found for the same hour:

As you can see, our calculations show much smaller fractions of credits attributed to the actual query runtimes for the first hour, with the bulk going to idle periods. This aligns much more closely with our expectations given the warehouse configuration, and it works historically!
Potential Issues
At the time of writing, we’ve identified a few potential problems with the new view:
- Warehouse ID mismatch — The
warehouse_idinQUERY_ATTRIBUTION_HISTORYdoesn't match the actualwarehouse_idfromQUERY_HISTORY. - Inflated query costs — The credits attributed to short queries seem disproportionately high in some cases.
- Idle time accounting — It’s unclear how idle time factors into the attribution, if at all.
We’ve raised these concerns with Snowflake, and they’ve recommended filing a support ticket for further investigation. In the meantime, we’ll continue to rely on our custom attribution logic for accuracy.
Our Approach to Query Cost Attribution
Given the discrepancies we’ve found, we wanted to share our methodology for calculating per-query costs, including idle time. Here’s an overview of our process:
- Gather warehouse suspend events
- Enrich query data with execution times and idle periods
- Create a timeline of all events (queries and idle periods)
- Join with
WAREHOUSE_METERING_HISTORYto attribute costs
Before we dive in, let’s cover a few basics:

- We use
WAREHOUSE_METERING_HISTORYas our source of truth for warehouse compute credits. The credits billed here will reconcile with Snowflake’s cost management dashboards. - Credits here are represented on an hourly grain. We like to refer to this as credits metered, analogous to how most homes in North America are metered for their electricity. In our solution, we’ll need to allocate queries and idle times into their metered hours.
- We use a weighted time-based approach to attribute costs within the metered hour. In reality, Snowflake’s credit attribution is likely much more complex, especially in situations with more clusters or warehouse scaling.

The full SQL query will be available at the end of this blog.
Step 1: Gather Warehouse Suspend Events
ASOF JOIN. Check out how to use ASOF JOINs here.First, we need to know when warehouses are suspended, this is pulled from WAREHOUSE_EVENTS_HISTORY .
WITH warehouse_events AS (
    SELECT
        warehouse_id
        , timestamp
        , LAG(timestamp) OVER (PARTITION BY warehouse_id ORDER BY timestamp) as lag_timestamp
    FROM snowflake.account_usage.warehouse_events_history
    WHERE
        event_name = 'SUSPEND_WAREHOUSE'
        AND DATEADD('DAY', 15, timestamp) >= current_date
)
It’s worth mentioning that the WAREHOUSE_EVENTS_HISTORY view has had a reputation for being somewhat unreliable. In fact, Ian from Select considered using this table in his cost-per-query analysis but ultimately decided against it due to these reliability concerns.
However, we’ve been in touch with a Snowflake engineer who informed us that recent updates have significantly improved the reliability of this table. While it may not be perfect, we're only using it for the suspended timestamp and not the cluster events, so it’s “close enough” for our purposes
In addition, warehouse suspension doesn’t actually occur during the SUSPEND_WAREHOUSE event. Technically, it happens when the WAREHOUSE_CONSISTENT event is logged. The WAREHOUSE_CONSISTENT event indicates that all compute resources associated with the warehouse have been fully released. You can find more information about this event in the Snowflake documentation.
For the sake of simplicity (and because the time difference is usually negligible), we’re sticking with the SUSPEND_WAREHOUSE event in our analysis. This approach gives us a good balance between accuracy and complexity in our cost attribution model.
Before moving onto enriching query data, we want to apply filters to reduce the load from table scans. Feel free to adjust the dates as you see fit.
WITH warehouse_list AS (
    SELECT
        DISTINCT warehouse_name,
        warehouse_id
    FROM warehouse_metering_history
    WHERE
        warehouse_name IS NOT NULL
        AND start_time >= $startDate
),

warehouse_events AS (
    SELECT
        weh.warehouse_id
        , weh.timestamp
    FROM warehouse_events_history as weh
    WHERE
        event_name = 'SUSPEND_WAREHOUSE'
),

queries_filtered AS (
    SELECT
        q.query_id
        , q.warehouse_id
        , q.warehouse_name
        , q.warehouse_size
        , q.role_name
        , q.user_name
        , q.query_text
        , q.query_hash
        , q.queued_overload_time
        , q.compilation_time
        , q.queued_provisioning_time
        , q.queued_repair_time
        , q.list_external_files_time
        , q.start_time
        , TIMEADD(
                'millisecond',
                q.queued_overload_time + q.compilation_time +
                q.queued_provisioning_time + q.queued_repair_time +
                q.list_external_files_time,
                q.start_time
            ) AS execution_start_time
        , q.end_time::timestamp AS end_time
        , w.timestamp AS suspended_at
        , MAX(q.end_time) OVER (PARTITION BY q.warehouse_id, w.timestamp ORDER BY execution_start_time ROWS BETWEEN UNBOUNDED PRECEDING AND CURRENT ROW) as end_time_max
        , LEAD(execution_start_time) OVER (PARTITION BY q.warehouse_id ORDER BY execution_start_time ASC) as next_query_at
    FROM query_history AS q
    ASOF JOIN warehouse_events AS w
        MATCH_CONDITION (q.end_time::timestamp <= w.timestamp)
        ON q.warehouse_id = w.warehouse_id
    WHERE
        q.warehouse_size IS NOT NULL
        AND q.execution_status = 'SUCCESS'
        AND start_time >= $startDate
        AND EXISTS (
            SELECT 1
            FROM warehouse_list AS wl
            WHERE
                q.warehouse_id = wl.warehouse_id
            )
)
Step 2: Enrich Query Data
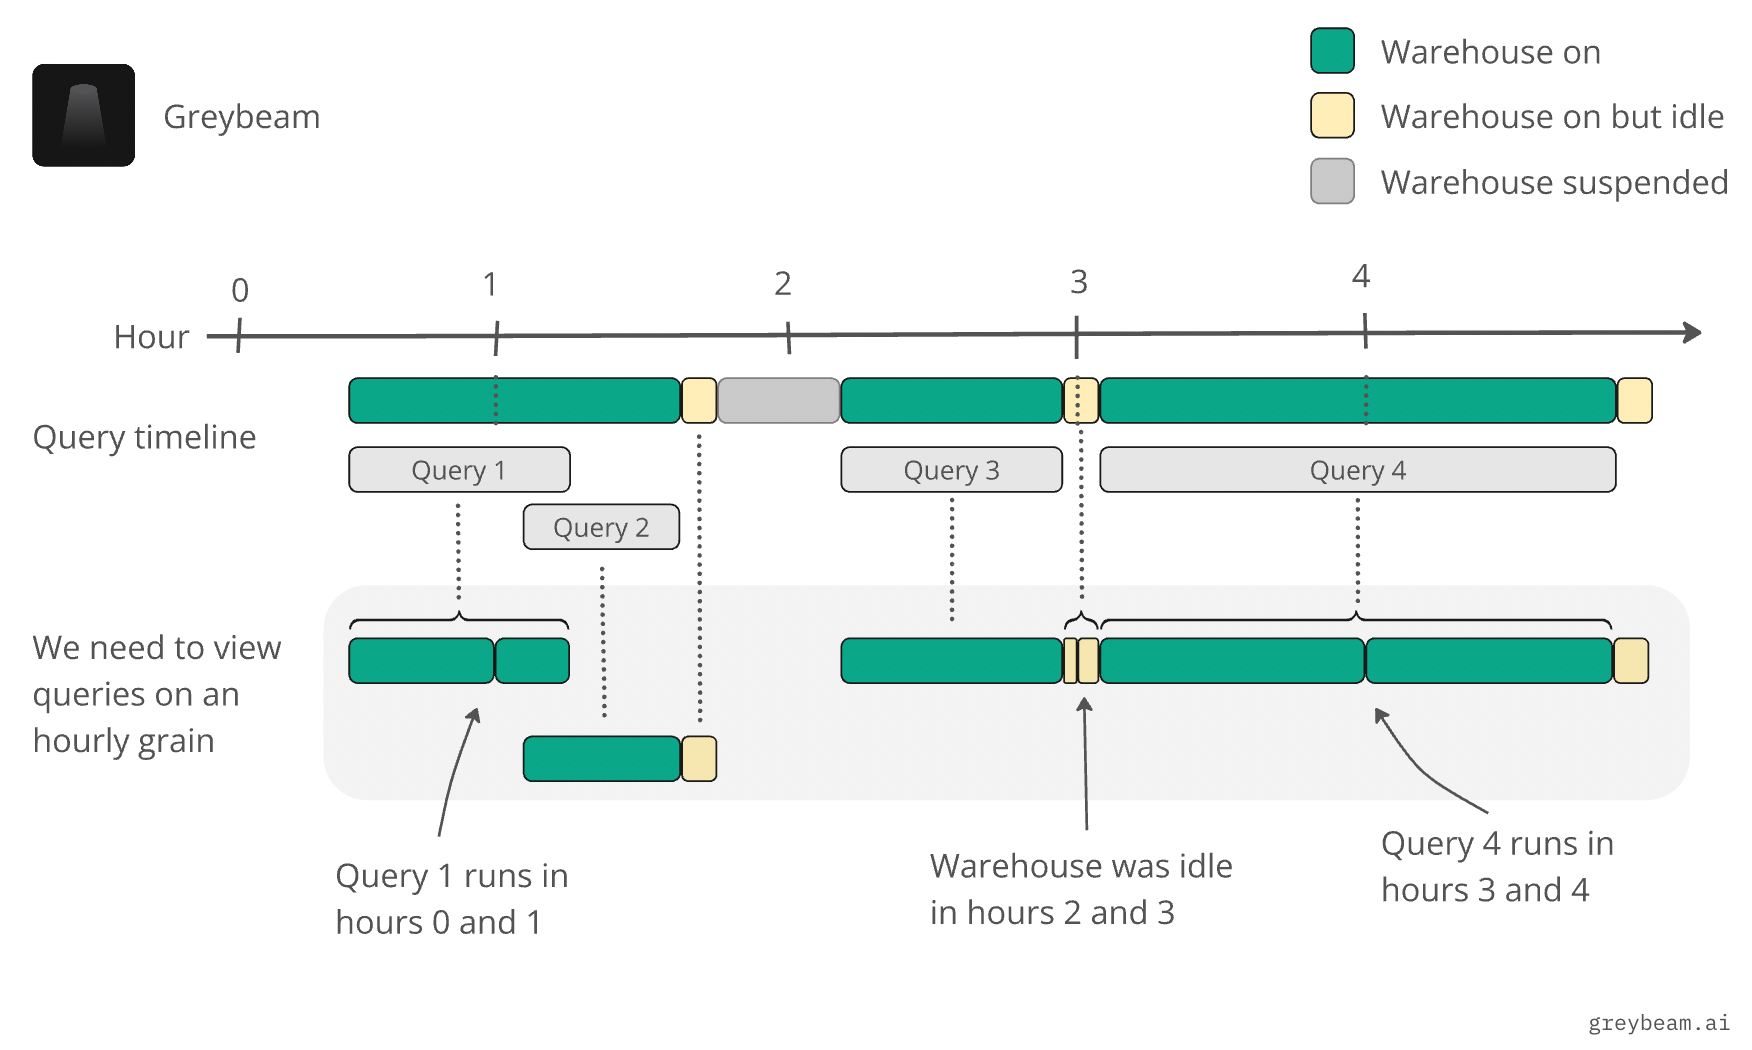
In this step, we take the raw query data and enrich it with additional information that will allow us to breakdown query and idle times into their hourly components. We choose hourly slots because the source of truth for credits comes from WAREHOUSE_METERING_HISTORY, which is on an hourly grain.
queries_enriched AS (
      SELECT
        q.query_id
        , q.warehouse_id
        , q.execution_start_time
        , q.end_time::timestamp AS end_time
        , q.end_time_max AS end_time_running
        , q.next_query_at
        , q.suspended_at
        , (CASE
            WHEN q.next_query_at > q.suspended_at THEN q.end_time_max
            WHEN q.next_query_at > q.end_time_max THEN q.end_time_max
            WHEN q.next_query_at < q.end_time_max THEN NULL
            WHEN q.next_query_at IS NULL THEN q.end_time
            END)::timestamp AS idle_start_at
        , IFF(idle_start_at IS NOT NULL, LEAST(COALESCE(next_query_at, '3000-01-01'), q.suspended_at), NULL)::timestamp AS idle_end_at
        , HOUR(execution_start_time::timestamp) = HOUR(q.end_time::timestamp) AS is_same_hour_query
        , HOUR(idle_start_at) = HOUR(idle_end_at) AS is_same_hour_idle
        , DATE_TRUNC('HOUR', execution_start_time) AS query_start_hour
        , DATE_TRUNC('HOUR', idle_start_at) as idle_start_hour
        , DATEDIFF('HOUR', execution_start_time, q.end_time) AS hours_span_query
        , DATEDIFF('HOUR', idle_start_at, idle_end_at) AS hours_span_idle
    FROM queries_filtered AS q
)
Key points to highlight:
- Execution Start Time: We calculate the actual execution start time that the query begins running on the warehouse (thanks Ian!).
- Idle Time Calculation: We determine idle periods by looking at the gap between our running query end time and the next query’s start time (or warehouse suspension time). This is because it's possible a prior query is still running, so we need to keep track of the running end time and compare it against the start time of the next query. If the next query starts after the end of our current query, then there’s idle time.
- Hour Boundaries: We identify queries and idle periods that span hour boundaries. This is important because Snowflake bills by the hour, so we need to properly attribute costs that cross these boundaries.
- Warehouse Suspension: We join with the warehouse_events table to identify when warehouses were suspended, which helps us accurately determine the end of idle periods. If the next query starts after the warehouse suspends, then the end of the idle period is the suspension time.
Step 3: Create Timeline of All Events
We now need to create an hourly timeline of all events so that we can reconcile our credits with WAREHOUSE_METERING_HISTORY. The timeline of all events can be broken down into 4 components:
- A query executed and ended in the same hour
- Idle time started and ended in the same hour
- A query executed and ended in a different hour
- Idle time started and ended in a different hour
1 and 2 are straight forward since they don’t cross any hourly boundaries we can simply select from the dataset and join directly to WAREHOUSE_METERING_HISTORY .
SELECT
        q.query_id
        , q.warehouse_id
        , 'query' AS type
        , q.execution_start_time AS event_start_at
        , q.end_time AS event_end_at
        , q.query_start_hour AS meter_start_hour
        , NULL AS meter_end_hour
        , q.execution_start_time AS meter_start_at
        , q.end_time AS meter_end_at
        , DATEDIFF('MILLISECOND', meter_start_at, meter_end_at)*0.001 AS meter_time_secs
    FROM queries_enriched AS q
    WHERE
        q.is_same_hour_query = TRUE

    UNION ALL

    SELECT
        'idle_' || q.query_id
        , q.warehouse_id
        , 'idle' AS type
        , q.idle_start_at AS event_start_at
        , q.idle_end_at AS event_end_at
        , q.idle_start_hour AS meter_start_hour
        , NULL AS meter_end_hour
        , q.idle_start_at AS meter_start_at
        , q.idle_end_at AS meter_end_at
        , DATEDIFF('MILLISECOND', meter_start_at, meter_end_at)*0.001 AS meter_time_secs
    FROM queries_enriched AS q
    WHERE
        q.is_same_hour_idle = TRUE
For 3 and 4, we need a record for each hour that the queries and idle times ran within. For example, if a query ran from 7:55PM to 10:40PM, we’d need a record for 7, 8, 9, and 10PM.


Originally we used a slightly more complicated join:
FROM queries_enriched AS q
JOIN SNOWFLAKE.ACCOUNT_USAGE.WAREHOUSE_METERING_HISTORY AS m
    ON q.warehouse_id = m.warehouse_id
    AND m.start_time >= q.meter_start_time
    AND m.start_time < q.end_time
This took forever to run on a large account. Instead, we first create records for each hour so that the join to WAREHOUSE_METERING_HISTORY is a direct join in the next step.
numgen AS (
    SELECT
        0 AS num
    UNION ALL

    SELECT
        ROW_NUMBER() OVER (ORDER BY NULL)
    FROM table(generator(ROWCOUNT=>24)) -- assuming no one has idle or queries running more than 24 hours
),

mega_timeline AS (
    -- parts 1 and 2 here

    SELECT
        'idle_' || q.query_id
        , q.warehouse_id
        , 'idle'
        , q.idle_start_at AS event_start_at
        , q.idle_end_at AS event_end_at
        , DATEADD('HOUR', n.num, DATE_TRUNC('HOUR', q.idle_start_at)) AS meter_start_hour
        , DATEADD('HOUR', n.num + 1, DATE_TRUNC('HOUR', q.idle_start_at)) AS meter_end_hour
        , GREATEST(meter_start_hour, q.idle_start_at) as meter_start_at
        , LEAST(meter_end_hour, q.idle_end_at) as meter_end_at
        , DATEDIFF('MILLISECOND', meter_start_at, meter_end_at)*0.001 AS meter_time_secs
    FROM queries_enriched AS q
    LEFT JOIN numgen AS n
        ON q.hours_span_idle >= n.num
    WHERE
        q.is_same_hour_idle = FALSE

    UNION ALL

    SELECT
        q.query_id
        , q.warehouse_id
        , 'query'
        , q.execution_start_time AS event_start_at
        , q.end_time AS event_end_at
        , DATEADD('HOUR', n.num, DATE_TRUNC('HOUR', q.execution_start_time)) AS meter_start_hour
        , DATEADD('HOUR', n.num + 1, DATE_TRUNC('HOUR', q.execution_start_time)) AS meter_end_hour
        , GREATEST(meter_start_hour, q.execution_start_time) as meter_start_at
        , LEAST(meter_end_hour, q.end_time) as meter_end_at
        , DATEDIFF('MILLISECOND', meter_start_at, meter_end_at)*0.001 AS meter_time_secs
    FROM queries_enriched AS q
    LEFT JOIN numgen AS n
        ON q.hours_span_query >= n.num
    WHERE
        q.is_same_hour_query = FALSE
)
Step 4: Attribute Costs
Finally, with each query and idle period properly allocated to their hourly slots, we can directly join to WAREHOUSE_METERING_HISTORY and calculate our credits used.
metered AS (
    SELECT
        m.query_id
        , m.warehouse_id
        , m.type
        , m.event_start_at
        , m.event_end_at
        , m.meter_start_hour
        , m.meter_start_at
        , m.meter_end_at
        , m.meter_time_secs
        , SUM(m.meter_time_secs) OVER (PARTITION BY m.warehouse_id, m.meter_start_hour) AS total_meter_time_secs
        , (m.meter_time_secs / total_meter_time_secs) * w.credits_used_compute AS credits_used
    FROM mega_timeline AS m
    JOIN snowflake.account_usage.warehouse_metering_history AS w -- inner join because both tables have different delays
        ON m.warehouse_id = w.warehouse_id
        AND m.meter_start_hour = w.start_time -- we can directly join now since we used our numgen method
)
In this approach we allocate credits based on the proportion of the total execution time in that hour:
- Time-based Weighting: We use the duration of each event (query or idle period) as the basis for our weighting. This is represented by
m.meter_time_secs. - Hourly Totals: We calculate the total time for all events within each hour for each warehouse
SUM(m.meter_time_secs) OVER (PARTITION BY m.warehouse_id, m.meter_start_hour). - Credit Allocation: We then allocate credits to each event based on its proportion of the total time in that hour
(m.meter_time_secs / total_meter_time_secs) * w.credits_used_compute.
One important note: This approach assumes that all time within an hour is equally valuable in terms of credit consumption. In reality, Snowflake may have more complex internal algorithms for credit attribution, especially for multi-cluster warehouses or warehouses that change size within an hour. However, this weighted time-based approach provides a reasonable and transparent method for cost attribution that aligns well with Snowflake’s consumption-based billing model.
Conclusion
While Snowflake’s new QUERY_ATTRIBUTION_HISTORY view is a promising step towards easier cost attribution, our initial testing reveals some potential issues that need to be addressed. For now, we recommend carefully validating the results against your own calculations and metering history.
We’re excited to see how this feature evolves and will continue to monitor its accuracy. In the meantime, implementing your own cost attribution logic can provide valuable insights into query performance and resource utilization.
By accounting for idle time and carefully tracking query execution across hour boundaries, we’re able to get a more complete and accurate picture of costs. This level of detail is crucial for optimizing Snowflake usage and controlling costs effectively.
Struggling with Snowflake costs?
All usage-based cloud platforms can get expensive when not used carefully. There are a ton of controls teams can fiddle with to get a handle on their Snowflake costs. At Greybeam, we’ve built a query performance and observability platform that automagically optimizes SQL queries sent to Snowflake, saving you thousands in compute costs. Reach out to [email protected] to learn more about how we can optimize your Snowflake environment.
Full SQL Cost Attribution
SET startDate = DATEADD('DAY', -15, current_date);
WITH warehouse_list AS (
    SELECT
        DISTINCT warehouse_name,
        warehouse_id
    FROM warehouse_metering_history
    WHERE
        warehouse_name IS NOT NULL
        AND start_time >= $startDate
),

warehouse_events AS (
    SELECT
        weh.warehouse_id
        , weh.timestamp
    FROM warehouse_events_history as weh
    WHERE
        event_name = 'SUSPEND_WAREHOUSE'
),

queries_filtered AS (
    SELECT
        q.query_id
        , q.warehouse_id
        , q.warehouse_name
        , q.warehouse_size
        , q.role_name
        , q.user_name
        , q.query_text
        , q.query_hash
        , q.queued_overload_time
        , q.compilation_time
        , q.queued_provisioning_time
        , q.queued_repair_time
        , q.list_external_files_time
        , q.start_time
        , TIMEADD(
                'millisecond',
                q.queued_overload_time + q.compilation_time +
                q.queued_provisioning_time + q.queued_repair_time +
                q.list_external_files_time,
                q.start_time
            ) AS execution_start_time
        , q.end_time::timestamp AS end_time
        , w.timestamp AS suspended_at
        , MAX(q.end_time) OVER (PARTITION BY q.warehouse_id, w.timestamp ORDER BY execution_start_time ROWS BETWEEN UNBOUNDED PRECEDING AND CURRENT ROW) as end_time_max
        , LEAD(execution_start_time) OVER (PARTITION BY q.warehouse_id ORDER BY execution_start_time ASC) as next_query_at
    FROM query_history AS q
    ASOF JOIN warehouse_events AS w
        MATCH_CONDITION (q.end_time::timestamp <= w.timestamp)
        ON q.warehouse_id = w.warehouse_id
    WHERE
        q.warehouse_size IS NOT NULL
        AND q.execution_status = 'SUCCESS'
        AND start_time >= $startDate
        AND EXISTS (
            SELECT 1
            FROM warehouse_list AS wl
            WHERE
                q.warehouse_id = wl.warehouse_id
            )
),

queries_enriched AS (
    SELECT
        q.query_id
        , q.warehouse_id
        , q.execution_start_time
        , q.end_time::timestamp AS end_time
        , q.end_time_max AS end_time_running
        , q.next_query_at
        , q.suspended_at
        , (CASE
            WHEN q.next_query_at > q.suspended_at THEN q.end_time_max
            WHEN q.next_query_at > q.end_time_max THEN q.end_time_max
            WHEN q.next_query_at < q.end_time_max THEN NULL
            WHEN q.next_query_at IS NULL THEN q.end_time
            END)::timestamp AS idle_start_at
        , IFF(idle_start_at IS NOT NULL, LEAST(COALESCE(next_query_at, '3000-01-01'), q.suspended_at), NULL)::timestamp AS idle_end_at
        , HOUR(execution_start_time::timestamp) = HOUR(q.end_time::timestamp) AS is_same_hour_query
        , HOUR(idle_start_at) = HOUR(idle_end_at) AS is_same_hour_idle
        , DATE_TRUNC('HOUR', execution_start_time) AS query_start_hour
        , DATE_TRUNC('HOUR', idle_start_at) as idle_start_hour
        , DATEDIFF('HOUR', execution_start_time, q.end_time) AS hours_span_query
        , DATEDIFF('HOUR', idle_start_at, idle_end_at) AS hours_span_idle
    FROM queries_filtered AS q
),

numgen AS (
    SELECT
        0 AS num
    UNION ALL

    SELECT
        ROW_NUMBER() OVER (ORDER BY NULL)
    FROM table(generator(ROWCOUNT=>24)) -- assuming no one has idle or queries running more than 24 hours
),

mega_timeline AS (
    SELECT
        q.query_id
        , q.warehouse_id
        , 'query' AS type
        , q.execution_start_time AS event_start_at
        , q.end_time AS event_end_at
        , DATEDIFF('MILLISECOND', event_start_at, event_end_at)*0.001 AS event_time_secs
        , q.query_start_hour AS meter_start_hour
        , NULL AS meter_end_hour
        , q.execution_start_time AS meter_start_at
        , q.end_time AS meter_end_at
        , DATEDIFF('MILLISECOND', meter_start_at, meter_end_at)*0.001 AS meter_time_secs
    FROM queries_enriched AS q
    WHERE
        q.is_same_hour_query = TRUE

    UNION ALL

    SELECT
        'idle_' || q.query_id
        , q.warehouse_id
        , 'idle' AS type
        , q.idle_start_at AS event_start_at
        , q.idle_end_at AS event_end_at
        , DATEDIFF('MILLISECOND', event_start_at, event_end_at)*0.001 AS event_time_secs
        , q.idle_start_hour AS meter_start_hour
        , NULL AS meter_end_hour
        , q.idle_start_at AS meter_start_at
        , q.idle_end_at AS meter_end_at
        , DATEDIFF('MILLISECOND', meter_start_at, meter_end_at)*0.001 AS meter_time_secs
    FROM queries_enriched AS q
    WHERE
        q.is_same_hour_idle = TRUE

    UNION ALL

    SELECT
        'idle_' || q.query_id
        , q.warehouse_id
        , 'idle'
        , q.idle_start_at AS event_start_at
        , q.idle_end_at AS event_end_at
        , DATEDIFF('MILLISECOND', event_start_at, event_end_at)*0.001 AS event_time_secs
        , DATEADD('HOUR', n.num, DATE_TRUNC('HOUR', q.idle_start_at)) AS meter_start_hour
        , DATEADD('HOUR', n.num + 1, DATE_TRUNC('HOUR', q.idle_start_at)) AS meter_end_hour
        , GREATEST(meter_start_hour, q.idle_start_at) as meter_start_at
        , LEAST(meter_end_hour, q.idle_end_at) as meter_end_at
        , DATEDIFF('MILLISECOND', meter_start_at, meter_end_at)*0.001 AS meter_time_secs
    FROM queries_enriched AS q
    LEFT JOIN numgen AS n
        ON q.hours_span_idle >= n.num
    WHERE
        q.is_same_hour_idle = FALSE

    UNION ALL

    SELECT
        q.query_id
        , q.warehouse_id
        , 'query'
        , q.execution_start_time AS event_start_at
        , q.end_time AS event_end_at
        , DATEDIFF('MILLISECOND', event_start_at, event_end_at)*0.001 AS event_time_secs
        , DATEADD('HOUR', n.num, DATE_TRUNC('HOUR', q.execution_start_time)) AS meter_start_hour
        , DATEADD('HOUR', n.num + 1, DATE_TRUNC('HOUR', q.execution_start_time)) AS meter_end_hour
        , GREATEST(meter_start_hour, q.execution_start_time) as meter_start_at
        , LEAST(meter_end_hour, q.end_time) as meter_end_at
        , DATEDIFF('MILLISECOND', meter_start_at, meter_end_at)*0.001 AS meter_time_secs
    FROM queries_enriched AS q
    LEFT JOIN numgen AS n
        ON q.hours_span_query >= n.num
    WHERE
        q.is_same_hour_query = FALSE
    ),

metered AS (
    SELECT
        m.query_id
        , REPLACE(m.query_id, 'idle_', '') as original_query_id
        , m.warehouse_id
        , m.type
        , m.event_start_at
        , m.event_end_at
        , m.event_time_secs
        , m.meter_start_hour
        , m.meter_start_at
        , m.meter_end_at
        , m.meter_time_secs
        , SUM(m.meter_time_secs) OVER (PARTITION BY m.warehouse_id, m.meter_start_hour) AS total_meter_time_secs
        , (m.meter_time_secs / total_meter_time_secs) * w.credits_used_compute AS credits_used
    FROM mega_timeline AS m
    JOIN warehouse_metering_history AS w
        ON m.warehouse_id = w.warehouse_id
        AND m.meter_start_hour = w.start_time
),

final AS (
    SELECT
        m.* EXCLUDE total_meter_time_secs, meter_end_at, original_query_id
        , q.query_text
        , q.query_hash
        , q.warehouse_size
        , q.warehouse_name
        , q.role_name
        , q.user_name
    FROM metered AS m
    JOIN queries_filtered AS q
        ON m.original_query_id = q.query_id
)
SELECT
    *
FROM final
;


Comments ()